You know I’m a big believer in data as a research tool – we did a story earlier this year about the different sources of data we have at our disposal, and how they highlight the mismatch between property investing and renters’ needs.
The Australian Bureau of Statistics (ABS) has just released the first tranche of 2021 data from the census. And if anything, it shows a greater mismatch, with access to affordable housing worsening since the 2016 census.
The Australian family household is getting smaller, comprising more singles (many of them women over 55) and couples without kids. As more people rent, and rents continue to go up, housing stress is affecting more people.
But we haven’t yet factored this into our social planning and housing decisions. More and more big homes get built and bought, which suit the families, but not the growing numbers of smaller households. I only have to look at my own situation. We started out as a family unit of two adults and four kids, and will probably have splintered into five separate, smaller homes within the next few years as my remaining kids move out.

And there’s less social housing, unbelievably. This all adds weight to the validity of – and urgent need for – co-living and HMO (house in multiple occupation).
Check out some of these key stats for investors.
HOUSEHOLDS GETTING SMALLER
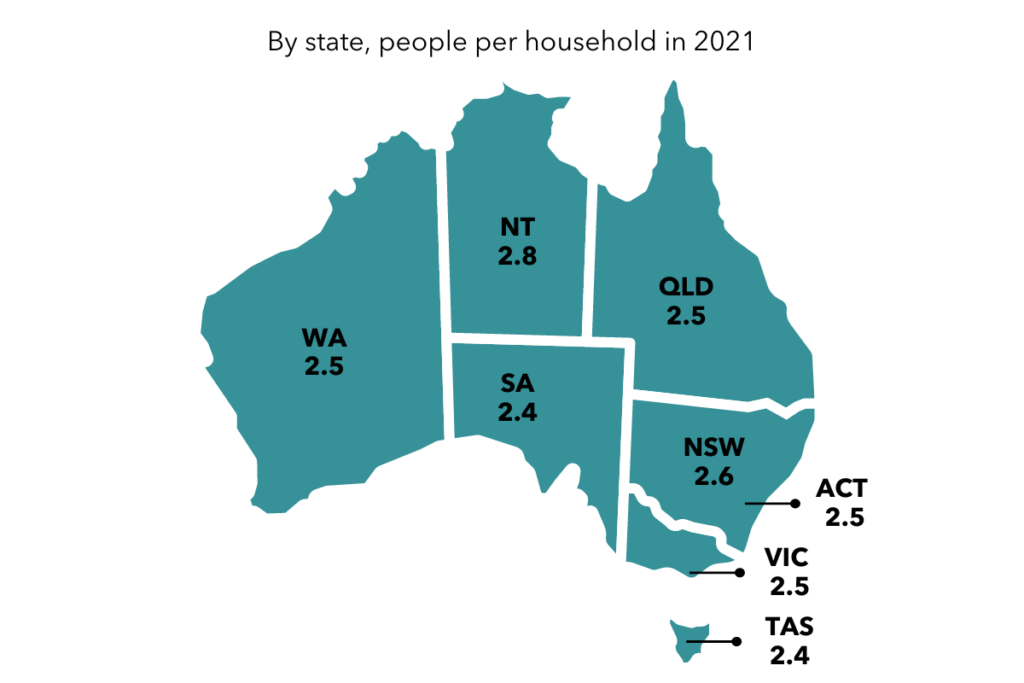
People per household: The average number of people per household has decreased since 2016.
2016 – 2.6
2021 – 2.5
Note that 50 years ago, the average number of people per household was 3.3.
People living alone
There are about 347,000 extra people living in single or lone-person households in 2021.
2016 – 2,023,542 people (24.4% of population)
2021 – 2,370,740 (25.6%)
As our population has increased, the proportion of lone households compared to other types of households has also increased, from 9.5% of total households in 2016, to 10.1% in 2021. (In 2016, the ABS predicted 24% to 27% of all Australian households would be lone households in 2041.)
While there are more younger men living alone than women, overall there are almost 300,000 more women than men living alone. From 55 years old, women start to significantly outnumber men, an ongoing trend.
People living as couples without kids
Not only are single household numbers growing, the number of ‘couple families’ living together without children has continued to rise.
2016 – 2,291,987
2021 – 2,608,834
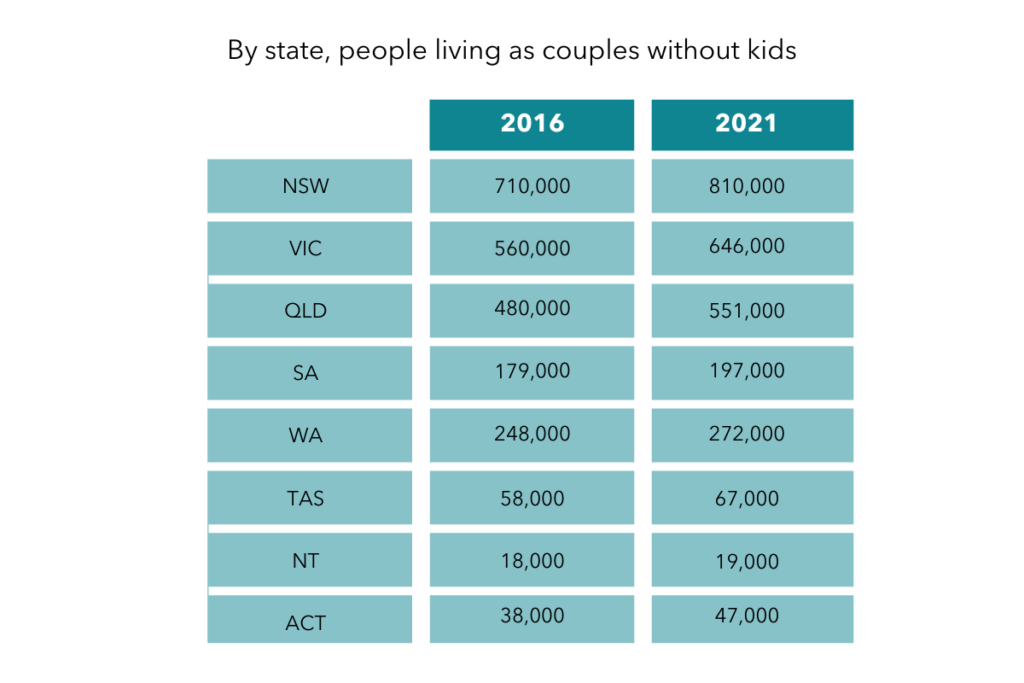
The proportion of couples without children compared to other types of households has also increased from 37.8% of the total in 2016, to 38.8% in 2021 (compared to couples with children – 43.7% in 2021 and 44.7% in 2016).
The number of couple families without children is projected to exceed the number of couple families with children and become the most common family type in Australia by 2029, according to ABS family projections data.
People shying away from share houses
Part of the reason there are more people living alone is likely because share houses have become a less appealing option.
Sharehouse or “group” households as a percentage of all households
2016 – 4.3%
2021 – 3.9%
We can put some of this down to the pandemic – fear of close contact, borders closing, international students moving home and living with their parents.
Time will tell whether there’s a reversal in these numbers. But the overall message is, our households have been shrinking for 100 years.

RENTERS IN AUSTRALIA
More renting households
2016 – 2,482,548
2021 – 2,842,378
One third of Australian households rent (30.6%) according to the 2021 census statistics with 359,830 more renting households recorded on census night in 2021 than in 2016, two thirds of those extras in NSW and Victoria.
Paying more rent
There’s been a $35 increase in the national median weekly rent over five years.
2016 – $340
2021 – $375
My bet is the increase would have been greater if residential rents hadn’t been levelled in COVID, or in some cases, reduced. We also had a huge international student housing market which essentially closed in the pandemic, leaving thousands of properties vacant and landlords forced to slash rents.
If we’d factored in rising rents after the August 2021 census date when the rental crisis really picked up, the story would be quite different.
Housing stress
The number of renting households putting more than 30% of their income towards rent – often considered an indicator of housing stress – rose to 915,317.
2021 – 915,317 or 32.2%
2016 – 893,973 or 36%
While the 2021 number is higher, you can see the proportional drop from 36% to 32% in housing stress. I attribute this in part to the Covid-induced amnesty on mortgage repayments, extra subsidies provided by the government and the hold on interest rates.
Some industry pundits have suggested it might also be because people are taking advantage of flexible work options and renting in cheaper areas.
We need to check on mortgage stress again in two to three years’ time, when the repercussions of interest rate rises will be felt in our communities and mortgagee sales will start happening.
Source: https://www.abs.gov.au/statistics/people/people-and-communities/snapshot-australia/2021
MORE BIG HOUSES, LESS SOCIAL HOUSING
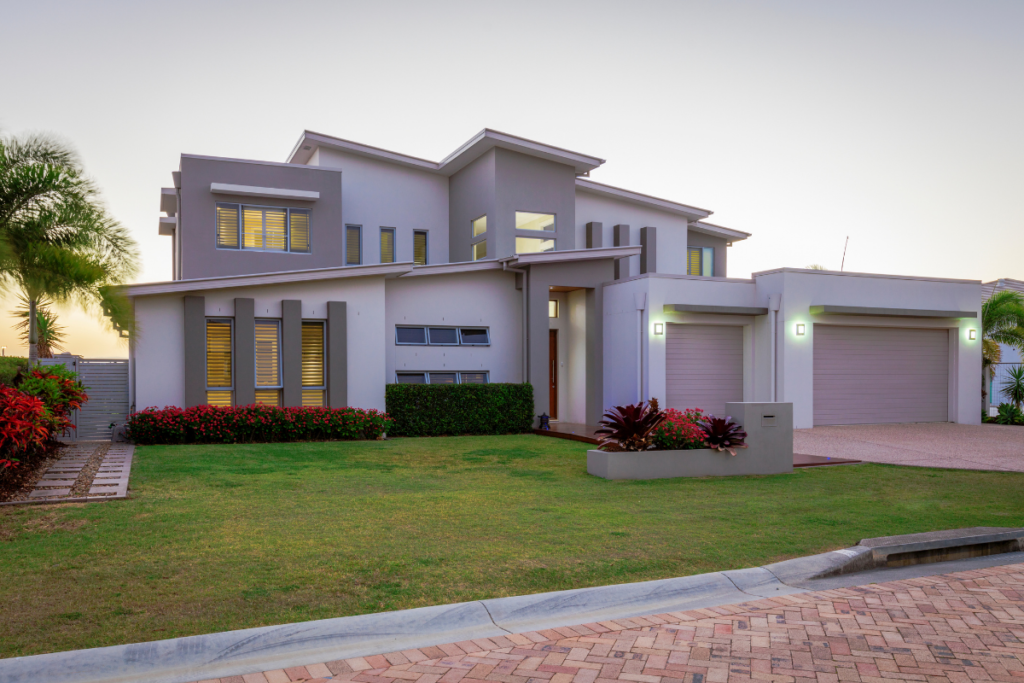
Still building bigger houses
There were nearly 11 million private dwellings counted in the 2021 Census, an increase of nearly a million since 2016.
At the same time, the percentage of dwellings with 4 or more bedrooms has gone up.
2016 – 32.2% (2,670,758) 2021 – 34.8% (3,224,351)
Public housing
Joel Dignam from tenant advocacy group Better Renting has been quoted as saying we’ve now got 25,000 less people living in public housing.
I’m not sure where this figure comes from, but I don’t doubt it. A report released by the Australian Institute of Health and Welfare (AIHW) says the number of people on waiting lists for public housing has grown by 8,900 since 2014, from 154,600 to 163,500.
Source: https://www.abs.gov.au/media-centre/media-releases/2021-census-count-includes-australians-living-wheels-and-water-most-us-still-firmly-land
What does all of this mean for investors?
The demand for quality, affordable housing is only going to increase. Yet, tenants also want autonomy and privacy. The co-living model provides a unique solution that helps renters save 1/2 to 1/3 off their typical weekly rent. Plus, it’s a cash flow positive solution for investors. As I’ve said before – it’s a WIN-WIN!
FIND OUT MORE by joining my upcoming webinar where I break down the co-living property strategy, HERE.

