One of my best tips for investing in property is to look at data from the past, including historical economic cycles. Observe what happened, why it happened, what the outcome was for investors. What are the nuggets you can take moving forward?
If you really want to learn how to invest in real estate, I’ve listed a few sources below, that I’ve found most useful in recent years.
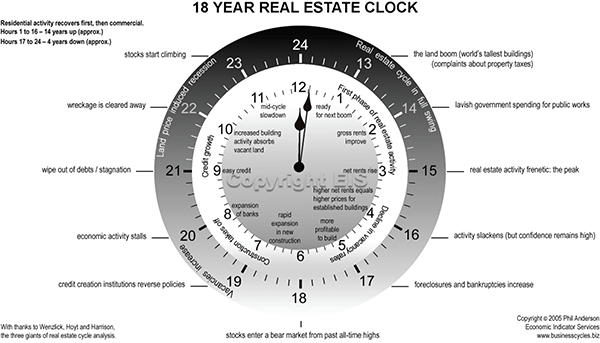
The 18.6 year property cycle.
This is the big one!
I’m a Phillip J. Anderson groupie. Phil is an Australian investment expert who lives in the UK.

Phil describes a property ‘up’ cycle of about 14 years, and then a three-and-a-half to four-year downturn, which adds up to 18.6 years on average. You can track this back for a couple of hundred years.
In the middle of the 14 ‘up’ years, you can have what is called a mid-cycle dip. For example, at the end of 2018/early 2019, there was a dip in the Australian market and everyone was saying Sydney was doomed. But it was actually a mid-cycle dip, which happens for different reasons.
Dips are often stock-market driven, with trigger events like 9/11, or the Fed lifting interest rates in the US, or the credit squeeze followed by the Cuban Missile Crisis in 1961. (It really pays to keep your eye on the US – we tend to follow their direction, e.g., the GFC. Also, to a lesser extent, China.)
So one of my best-ever investing-in-property tips is study this 18-year cycle, and always ask yourself where we are in it. Here’s an even older graph which supports the 18-year theory.

Data about past pandemics
We had the Spanish Flu pandemic from 1918 to 1919 (not caused by the Spaniards, I have to point out, since I’m Spanish). And then the “Roaring ‘20s” describes the boom that happened after, from 1921 to 1929.

I’m not saying our current boom will last eight years but I am seeing some good indicators that we’ll have a boost from where we are now, until 2025 or 2026.
Election cycles
When an election is announced, you see stagnation in the property market for one to three months. People wait to see who comes into power and what policies they might introduce, for example the Labor government might instigate changes to negative gearing.
I believe that is a good time for investors to buy, because the market will continue to move after that.
Consumer price index and inflation
This graph shows underlying inflation at about 2.1%. That’s the highest in seven years, with the greatest impact on new dwellings and fuel.
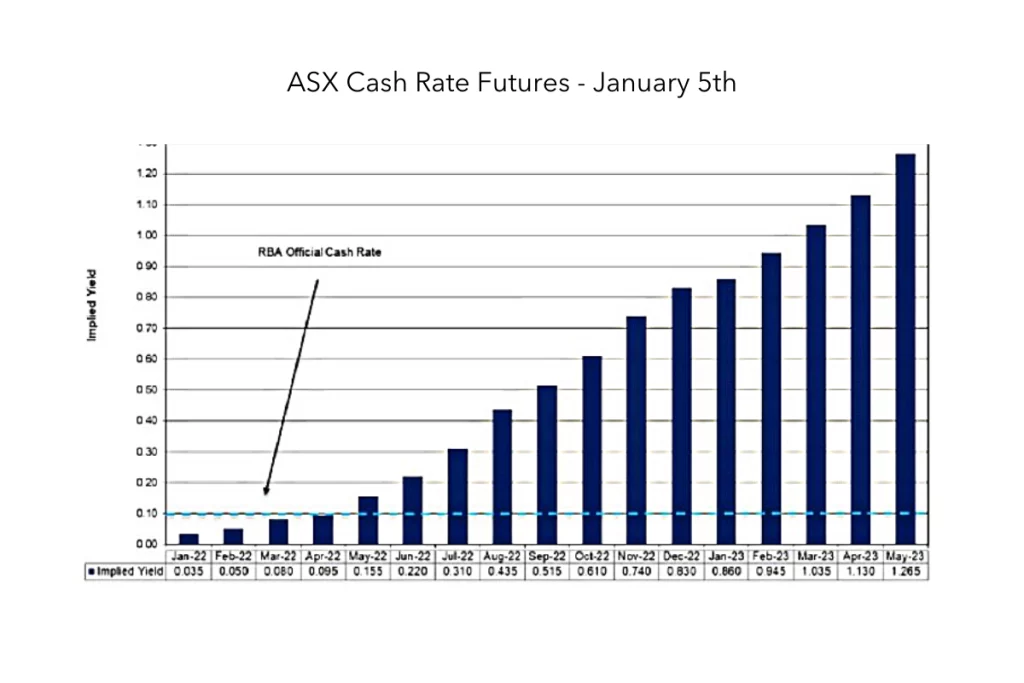
Globally, interest rates are very, very low. When inflation increases over time, the only way to fix it is through increasing interest rates.
In Australia, they’re projected to trend around 1.25% in 2023 and 1.50% in 2024. You should certainly be doing your numbers today based on interest rates increasing by 2% in 2025, even 5%, or 8% if you’re really conservative. Personally I’d call it midway at 3.5% percent in 2025.


The RBA governor Philip Lowe may not increase interest rates substantially until 2024, but individual banks will, looking over their shoulders at what their competitors do.

Key influences on the housing market over the last 140 years
If you’re in a standard, every-day, four-bedroom home, it’s very unlikely the price will drop by 10% regardless of major events.

Compound growth in property
This graphic shows median house prices have grown 5.9% per annum on a compound basis since 1900. When you take inflation into account between 1900 and 1921, this compound rate drops to just 2.2%. Now you might say, 2.2% growth? That’s not a great rate.
But what it translates to is more like 6% per annum over that time, given there’s zero inflation on property.
And as we know too well, property prices reliably double every seven to 10 years, in capital cities at least.

The Skyscraper Index
Seems like an out-there property investing tip, but this model is based on the idea that economies drop just after the completion of major skyscrapers or infrastructure projects. That’s when everyday citizens experience financial hurt, according to British economist, Andrew Lawrence.
At the time when these big projects are shopped around, the banks are comfortable lending money based on their forecasts. This indicates high economic expansion, which is inevitably followed by a bust. FYI, there are currently a whole lot of buildings due for completion 2026 to 2027.
That’s just seven of them. I talk more about cycles and data in my State of the Market webinar. You might want to keep an eye on these additional sources:
- The Consumer Sentiment Index
- National dwelling approval rates
- Net loss of people in Australian states through internal migration
- National household debt
- Home loan delinquency rates and the regions most affected

And finally, while we’re learning how to invest in real estate, here are my 3 factors you should definitely take with a grain of salt
- Minor glitches in a cycle. For instance, in January every year people pull their belts in after spending big at Christmas on holidays etc., so consumer spending goes down. Also there’s a decrease in dwelling approvals, which don’t kick into gear until February.
- When two or three property writers publish articles saying, “the sky is falling”. In all likelihood, it will be a short breather, then bang – you’re off again. Research always trumps a sensationalist headline.
- Economists from the banks giving their regular market forecasts. In 2020, NAB said houses prices could drop by potentially 20.9% in that year, and 11.8% in 2021 before rebounding by 2.5% in 2022. I rest my case.
Disclaimer: The information in this blog is provided for educational purposes only. It does not constitute advice or recommendations and should not be relied on as such. You should obtain your own appropriate legal or financial advice relevant to your situation.


